Scaling Terraform Governance Across 16+ GCP Projects
How I centralized Terraform execution, automated drift detection, decomposed large state files, introduced app-of-apps GitOps, improved QA observability, and automated cost controls across a multi-project GCP portfolio.
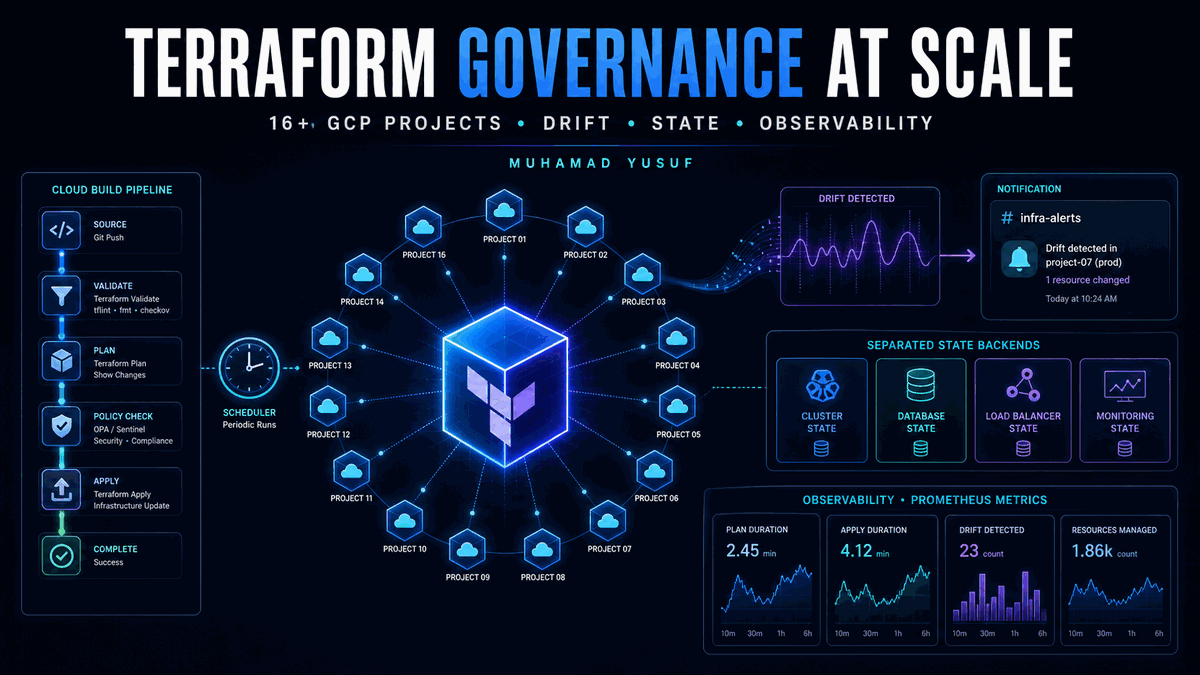
Managing one Terraform project is mostly an infrastructure problem. Managing more than 16 active cloud projects is also a governance problem: execution must be consistent, drift must be visible, state must remain maintainable, and teams need enough observability to make safe decisions without waiting for DevOps.
At Modeso, I worked as one of the DevOps engineers deploying and supporting a portfolio of enterprise products across multiple cloud projects. This article describes several improvements I designed and implemented while supporting that portfolio.
The common objective was not to add more tools. It was to create a safer operating model that engineering and QA teams could understand and use.
The Problems That Appear at Portfolio Scale
As the number of projects grows, several risks compound:
- Terraform can be executed from different laptops with different versions, credentials, and local environments.
- A manual cloud-console change can remain unnoticed until a later deployment.
- A large shared state increases blast radius and slows routine plans and applies.
- QA teams lack database and queue visibility during performance or integration tests.
- Non-production environments continue running when nobody is using them.
- Permanent broad access becomes the default because it appears operationally convenient.
I addressed these as related platform concerns rather than isolated tickets.
Centralizing Terraform Plan and Apply in Cloud Build
The first step was to make Cloud Build the controlled execution path for Terraform.
The pipeline accepts the target module, environment, Terraform image, and requested operation as substitutions. It initializes the correct remote backend and runs either terraform plan or terraform apply. Apply is permitted only from the protected main branch, while a dedicated Cloud Build service account performs the cloud operations.
This design provides several advantages:
- The Terraform version and runtime are consistent.
- Plans and applies produce centralized logs.
- Branch policy becomes part of the deployment control.
- The execution identity is a workload identity, not a developer laptop.
- Review and approval happen before the infrastructure change.
Moving Terraform behind the pipeline also changed the access model. The team no longer needed permanent local infrastructure credentials for routine delivery. Privileged work could use controlled, time-bound access through Google Privileged Access Manager, while IAP provided the private administrative path to protected compute resources.
The important principle is that pipeline adoption alone is not a security boundary. The surrounding IAM model, branch protection, remote state permissions, and privileged-access process must all reinforce the same operating path.
Detecting Drift Before It Becomes an Incident
Centralized applies do not stop every manual change. Operations, incident response, provider behavior, or an emergency console update can still create drift.
I built a scheduled drift-detection workflow using Terraform, Cloud Scheduler, Cloud Build, Secret Manager, and Google Chat:
- Cloud Scheduler calls the Cloud Build trigger API using a service account.
- Cloud Build checks out the infrastructure repository.
- The job loops through the configured infrastructure domains and environments.
- Each module runs
terraform plan -detailed-exitcode. - Exit code
0means no difference,2means changes exist, and any other code is treated as a failed check. - A Google Chat message is sent only when drift is detected, with the affected modules and a link to the build.
The Google Chat webhook remains in Secret Manager and is injected only into the notification step. This keeps the integration credential out of the repository and prevents routine no-change runs from creating alert noise.
The result is a lightweight daily control: the team sees unexpected differences before they are mixed into a planned release.
Decomposing a Large Terraform State Safely
One of the most sensitive changes involved a large Terraform repository for one of Modeso’s enterprise projects. Development and production had each grown around a large state containing many resources and modules. That structure increased plan time, lock contention, review noise, and the potential blast radius of an incorrect operation.
I proposed separating the infrastructure by operational domain. The repository was reorganized into four independently managed areas for each environment:
- GKE cluster and supporting compute resources
- Cloud SQL
- Load balancing and certificates
- Monitoring and alerting
Each area received its own backend prefix and state lifecycle. The migration required more than moving files. Existing resources had to be mapped to their new addresses, imported or moved without recreation, and verified with zero-change plans before normal delivery resumed.
The split improved:
- Smaller and faster plans
- Reduced state-lock contention
- Clearer ownership boundaries
- Lower blast radius
- Easier troubleshooting and rollback
- Independent changes to databases, clusters, load balancers, and monitoring
State decomposition is valuable when it follows operational boundaries. Splitting only to reduce file size can create unnecessary dependencies and make deployments harder to coordinate.
Giving QA Useful MongoDB and RabbitMQ Metrics
During testing, a healthy Kubernetes deployment does not answer the questions QA needs: Is the queue backing up? Are consumers keeping pace? Is MongoDB cache pressure increasing? Are connections, locks, or query behavior changing under load?
I integrated MongoDB and RabbitMQ with Google Cloud Managed Service for Prometheus in GKE.
For MongoDB, the implementation included:
- A dedicated MongoDB exporter
- A least-privilege monitoring user
PodMonitoringfor metric collection- A
NetworkPolicyallowing metric access only from the managed Prometheus namespace - Collectors for server, database, collection, replica-set, and WiredTiger metrics
RabbitMQ exposed its Prometheus endpoint through the same managed collection model, with a dedicated PodMonitoring resource and restricted network access.
The metrics became available in Cloud Monitoring Metrics Explorer and in focused dashboards used during integration and performance tests. Instead of asking DevOps to inspect pods manually, QA could correlate test behavior with queue depth, consumer activity, database operations, resource pressure, and application symptoms.
This was a good example of platform work improving team capability rather than only infrastructure capability.
Turning Billing Data into an Operating Model
For one three-environment non-production portfolio, I analyzed a month of billing exports across testing, UAT, and performance. The baseline was CHF 354.05 per month, concentrated in Cloud SQL, Cloud Run, and networking.
The proposed first phase combined:
- Scheduled weekday operation for UAT
- On-demand start and stop workflows for testing and performance
- Safety shutdowns for forgotten environments
- Cloud Run manual scaling to zero while environments are disabled
- Cloud SQL shutdown outside approved windows
- A monitored database-rightsizing pilot for testing
- Dedicated workflow identities so developers could start environments without direct SQL or Cloud Run administration
The estimated target was CHF 118.03 per month, a projected saving of CHF 236.02 or 66.7%. Networking costs remained in the estimate, making the target deliberately conservative until load-balancer, NAT, and static-egress requirements could be assessed separately.
Cost optimization becomes sustainable when it changes the operating model. A one-time rightsizing exercise is useful, but automated schedules, delegated workflows, monitoring, and explicit availability expectations prevent the same waste from returning.
Automating Scheduled and On-Demand Environments
I applied the same operating-model principle to two Modeso projects where non-production Kubernetes and database capacity did not need to run at full size overnight.
For the first project, the automation records the active size of each selected GKE node pool before scaling it to zero, stops the selected Cloud SQL instances, and temporarily disables alerts that would otherwise fire because of the planned shutdown. The morning workflow reads the previous successful scale-down output, restores each node pool to its recorded size, starts only the databases that were stopped, waits for the platform to stabilize, and re-enables the monitoring policies.
This preserves the environment’s real operating size instead of relying on hard-coded morning capacity. It also prevents scheduled shutdowns from creating false incidents.
The second project required a more granular model because development, acceptance, patch, staging, and testing environments shared cluster capacity. The scale-down workflow reduces application deployments and stateful workloads, lowers the node pools, and stops shared compute that is not needed overnight.
Scale-up is requested per environment rather than starting the entire platform:
- The workflow validates the requested environment and exits if it is already active.
- It counts the environments currently running.
- Application and shared data-node capacity are calculated from active demand and capped safely.
- Shared database compute starts only when the first environment is activated.
- Stateful workloads are restored in a controlled order.
- Only the Argo CD applications targeting the requested namespace are synchronized.
This allowed developers and business users to activate the environment they needed without paying for every environment continuously.
Managing Kubernetes Delivery with App-of-Apps
Across both projects, I worked with Argo CD’s app-of-apps pattern to manage large sets of services declaratively. Environment value files define the applications, namespaces, repositories, Helm values, and Argo CD projects that should exist.
The model provides one controlled entry point for onboarding or changing services while still producing separate Argo CD Application resources. Stateless services can follow the standard synchronization policy, while data services use stricter behavior, including manual synchronization and protection from automatic pruning.
Combining app-of-apps with the per-environment scale-up workflow was especially useful: infrastructure capacity starts first, stateful components become ready, and Argo CD then reconciles only the applications for the environment that was requested.
Rotating Production Support
Platform ownership also included approximately two weeks per month in a rotating 24/7 production-support schedule. I configured and maintained application, Kubernetes, database, load-balancer, and infrastructure alerts that fed the on-call process through Cloud Operations, PagerDuty, and Opsgenie.
The work included release support, triage, incident coordination, postmortems, alert tuning, and production hardening. Scheduled maintenance automation also controlled expected alerts during planned shutdown and restored them when environments returned, reducing noise without hiding real failures.
What Made These Changes Valuable
The technical components mattered, but their value came from how teams used them:
- Developers received repeatable delivery paths instead of laptop-specific instructions.
- DevOps received auditable Terraform execution and early drift visibility.
- QA received actionable platform metrics during testing.
- Product teams received clearer cost and availability trade-offs.
- Development teams could activate only the non-production environments they needed.
- Security controls became part of routine delivery rather than a final review step.
- On-call work through PagerDuty and Opsgenie had better logs, metrics, and infrastructure context.
The most important contribution a DevOps engineer can make is not installing tools. It is transferring an operating culture: infrastructure is reviewed, changes are reproducible, access is temporary, signals are visible, ownership is shared, and every team can safely participate in delivery.